Tag Archives: phase curve

The changing atmosphere of WASP-121b

NASA have put out a press release about observations of hot-Jupiter exoplanet WASP-121b. A team led by ESA scientist Quentin Changeat analysed observations with the Hubble Space Telescope made in 2016, 2018 and 2019 to find distinct differences in the atmosphere of the planet, revealing that planets have weather patterns.

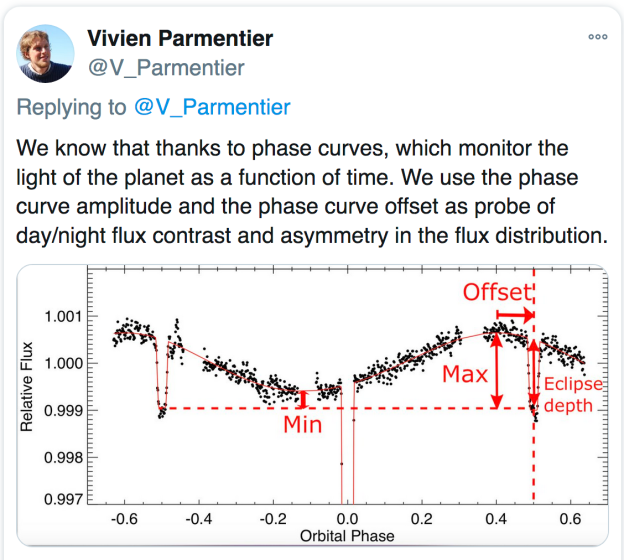
The figure below shows the “phase curve”, a smooth variation caused by the varying visibility of the heated face of the planet (there are also sharp dips caused by the eclipse and transit of the star/planet). Differences between the phase curve in different years indicate changes in the atmosphere.

Heat maps of WASP-121b show the changing temperatures of the irradiated face of WASP-121b.

The press release has led to articles on WASP-121b on dozens of websites across the world.

Nightside clouds explain hot-Jupiter phase curves

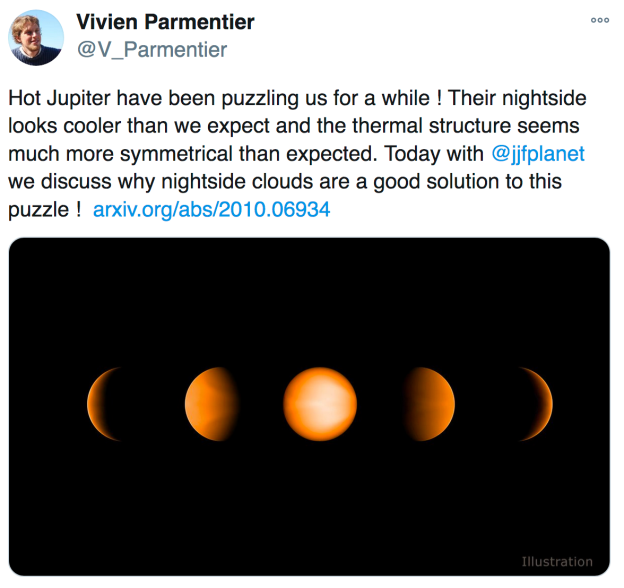
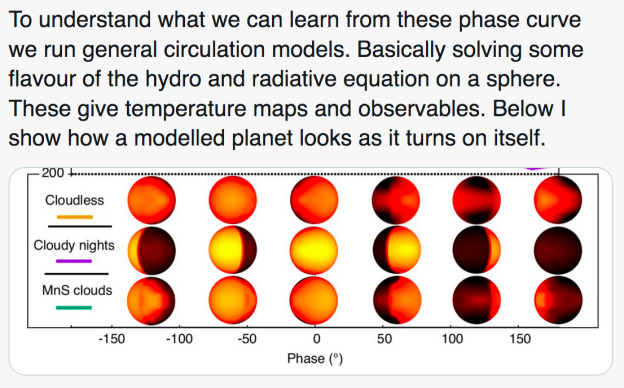
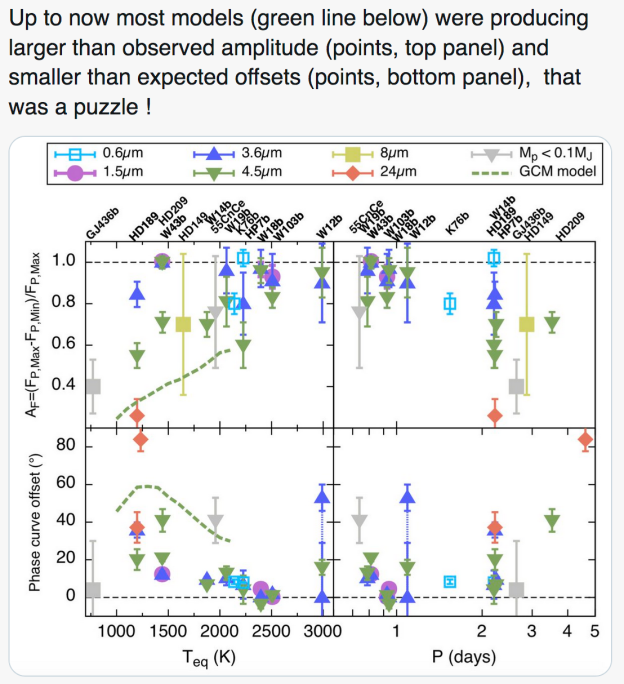
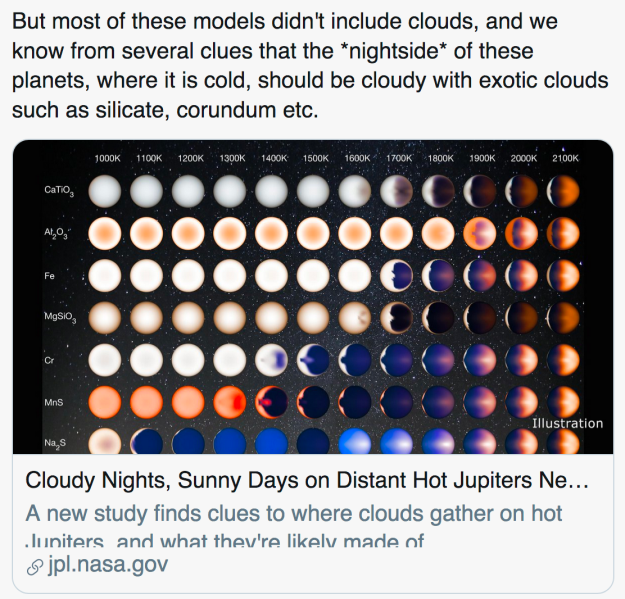
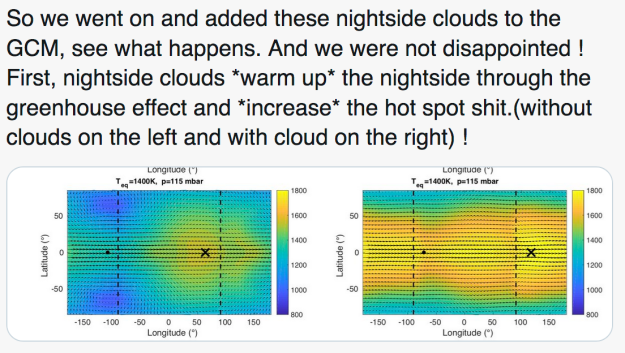
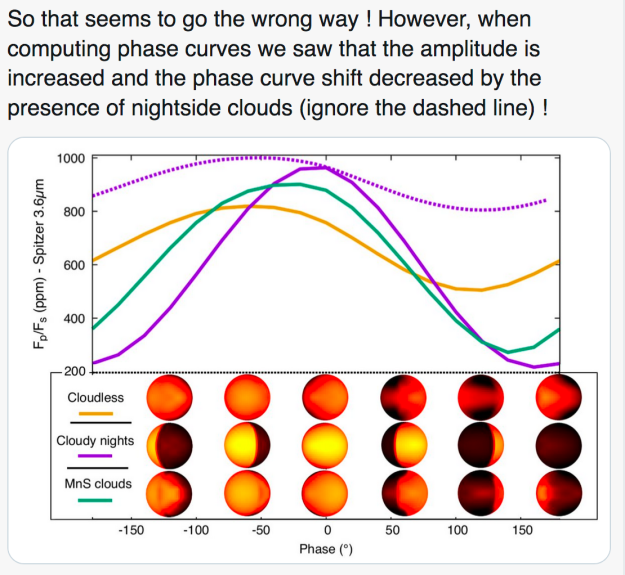
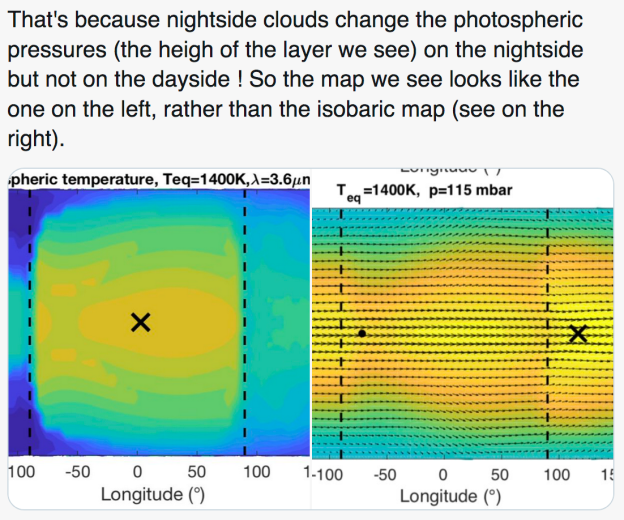
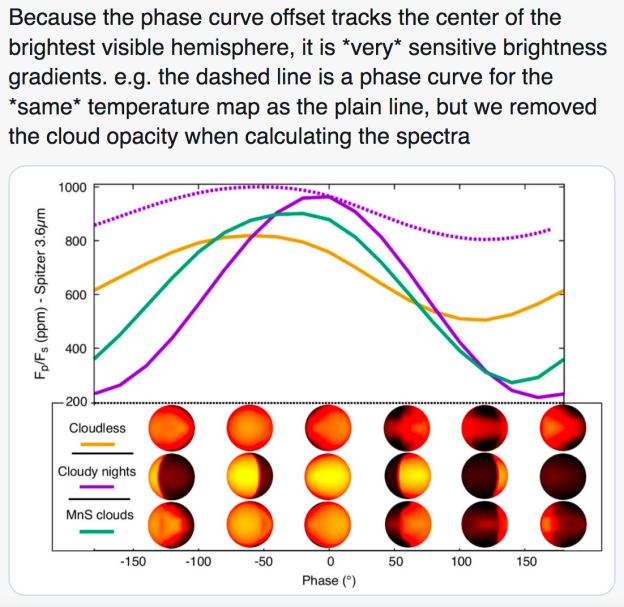
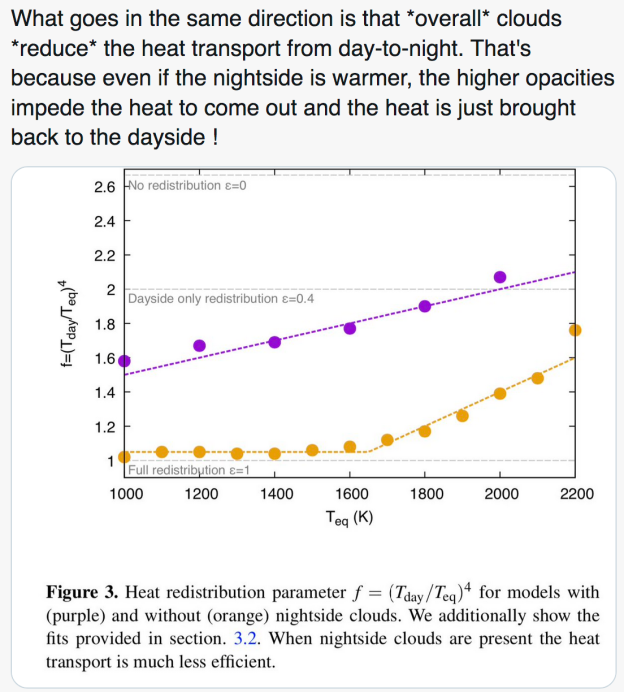
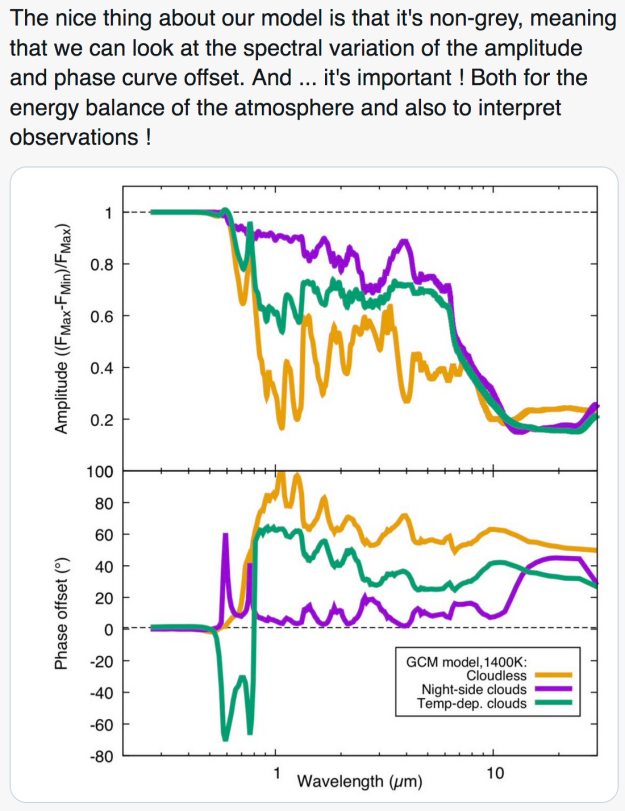
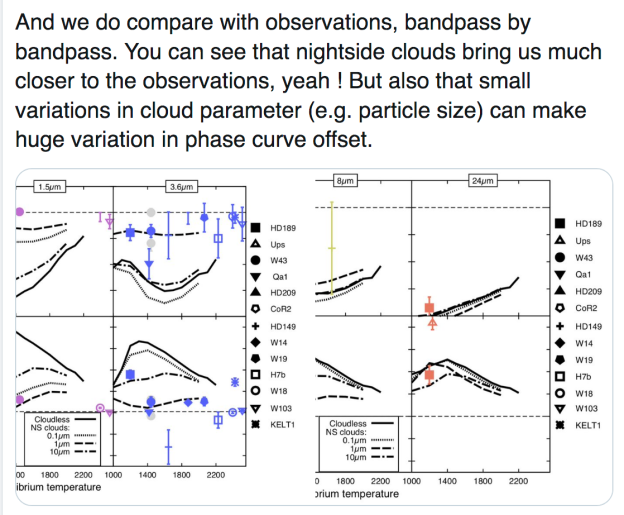
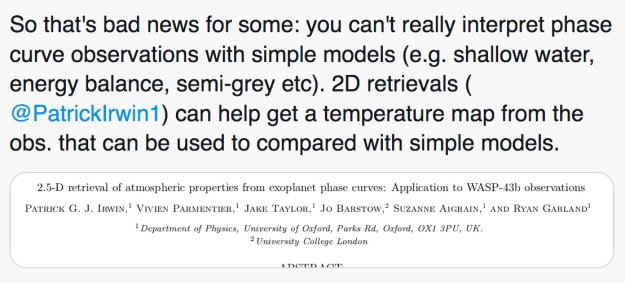
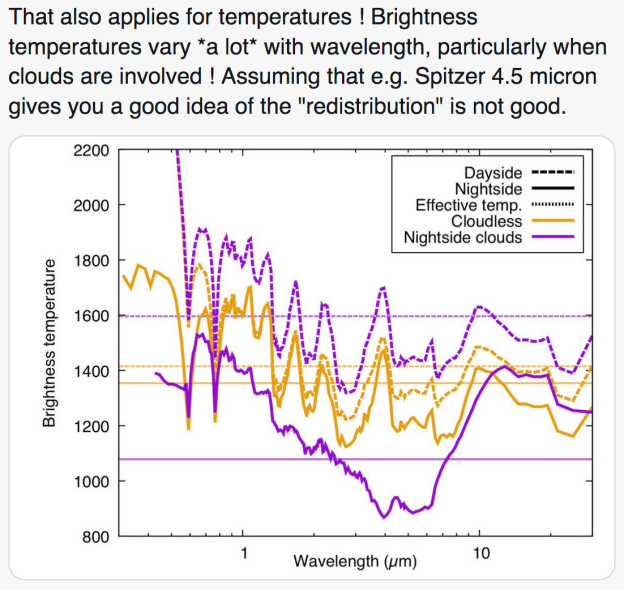
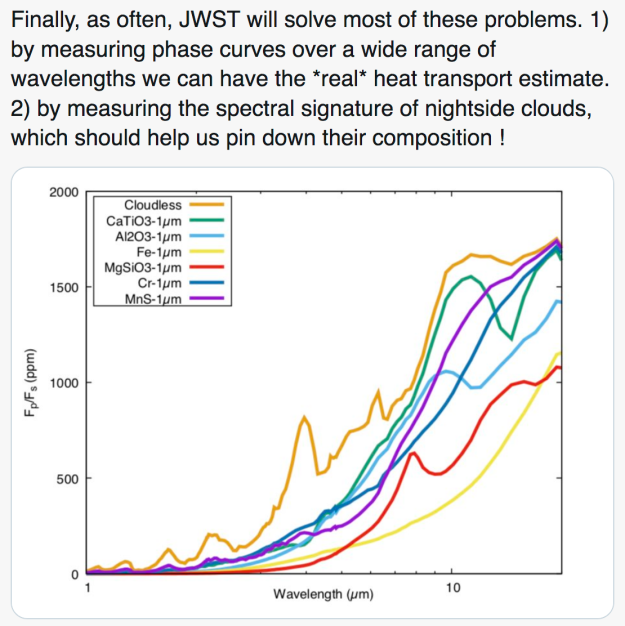
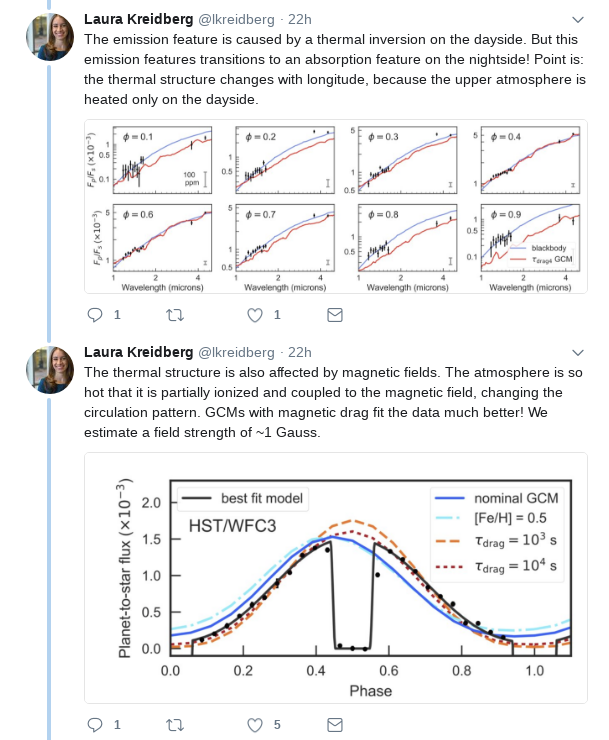
Vivien Parmentier (Oxford University, @V_Parmentier) has produced an explanatory Twitter thread on his latest paper with Jonathan Fortney (@jjfplanet). Since this concerns WASP exoplanets, let’s reproduce it here:


[The symbols include data points for WASP-43b, WASP-14b, WASP-19b, WASP-18b and WASP-103b, along with other hot Jupiters.]


TESS phase curve of WASP-19b

The space-based photometry from the TESS satellite is producing high-quality light curves of many of the WASP exoplanets. Here is the lightcurve of WASP-19b, from a new paper by Ian Wong et al:

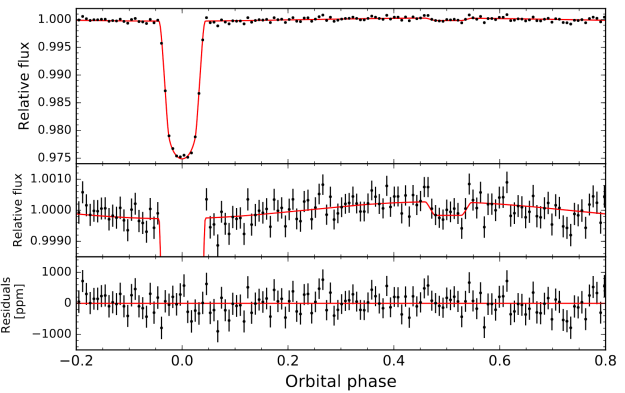
In addition to the transit (phase zero), the lightcurve shows a shallower eclipse of the planet (phase 0.5) and a broad variation caused by the changing aspect of the heated face of the planet. Unlike in some planets, the hottest part of the planet directly faces the star, so there is no offset in the phase of the broad modulation.

Wong et al deduce that the dayside face of the planet is heated to 2240 ± 40 K, that there is no flux detected from the colder night side, and that the planet reflects 16 ± 4 percent of the light that falls on it. The last value is relatively high compared to other planets.

WASP-121b observed by TESS

As is sometimes the way when prime observations are open access, two independent papers (Daylan et al 2019; Bourrier et al 2019) have, on the same day, announced independent analyses of the TESS lightcurve of the ultra-hot Jupiter WASP-121b.

The phase curve shows the transit (time zero), a “phase curve” modulation caused by the varying visibility of the heated face of the planet (illustrated by schematics of the planet), and the eclipse (when the planet passes behind the star, at −15 hr).

Both analyses report similar findings, saying that the heated “hot spot” directly faces the star, rather than being offset in phase, which suggests that any re-circulation of heat by planetary winds is inefficient.

The planet’s atmosphere shows a temperature inversion (it is hotter at higher altitudes), which could result from absorption of heat by molecules of titanium and vanadium oxide, and H-minus ions.

Hot Jupiter irradiation and the efficiency of heat recirculation

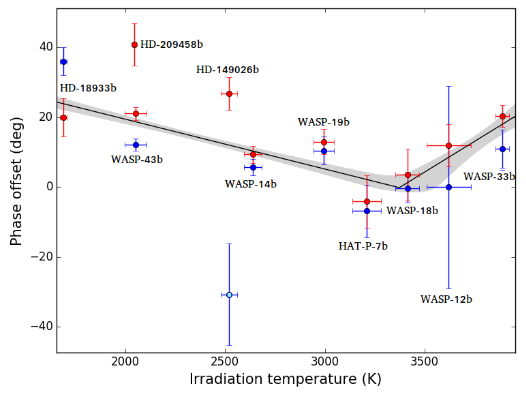
Here’s an interesting plot from a new paper by Michael Zhang et al.

The x-axis is the irradiation temperature for a sample of hot-Jupiter exoplanets; that is, how blasted the day-side of their atmosphere is by irradiation from the host star. This depends on the temperature of the star, its size, and the closeness of the orbit.

The heat of the day side of the planet is then transported to the night side by winds (the planets are phase-locked, so the same side always faces the star). The efficiency of this re-circulation of heat then determines whether the hottest regions of the planet are directly facing the star, or whether they are offset by some angle. This angle can by measured by looking at the “phase curve” radiation in the infra-red.

The y-axis then shows the observed offset angle as a function of the irradiation. The plot shows that the offset angle appears to be highest for cooler planets, and then decreases as irradiation increases, but then perhaps increases again for the very hottest planets such as WASP-33b.

There is, however, also a lot of scatter in the plot. The authors speculate that this might result from differing metallicities of the planets, which affects how well they form clouds, which can then determine the albedo of the planet, and thus how much irradiation is simply reflected.

Changeable weather on exoplanet WASP-43b?

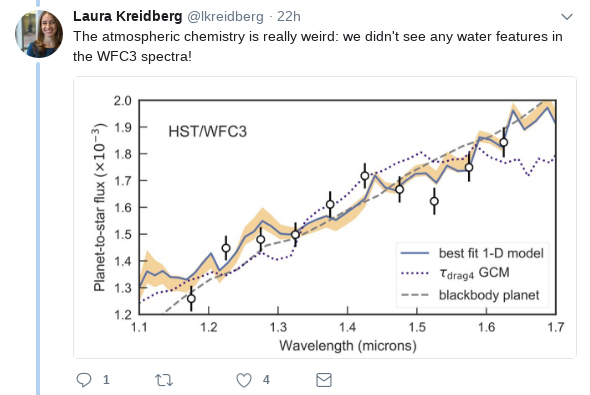
WASP-43b is the “hot Jupiter” exoplanet with the orbit closest-in to its star, producing an ultra-short orbital period of only 20 hours. The dayside face is thus strongly heated, making it a prime system for studying exoplanet atmospheres.

Kevin Stevenson et al have pointed NASA’s Spitzer Space Telescope at WASP-43, covering the full orbit of the planet on three different occasions. Spitzer observed the infrared light from the heated face in two bands around 3.6 microns and 4.5 microns.

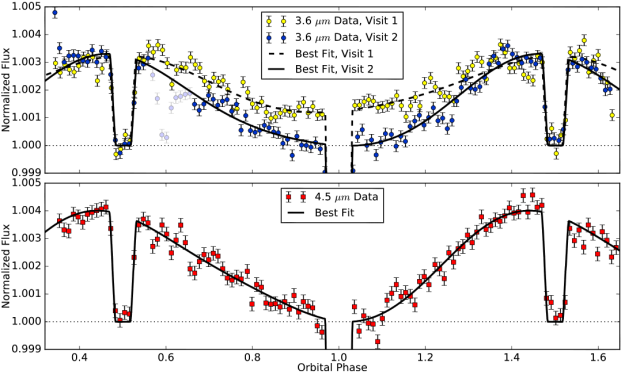
The three resulting “phase curves” are shown in the figure:

Spitzer phase curves of exoplanet WASP-43b

The 4.5-micron data from one visit are shown in red in the lower panel; the 3.6-micron data from the two other visits are in the upper panel. The transit (when the planet passes in front of the star) is at phase 1.0, and drops below the plotted figure. The planet occultation (when it passes behind the star) is at phase 0.5. The sinusoidal variation results from the heated face of the planet facing towards us (near phase 0.5) or away (near phase 1.0).

Intriguingly, the depth of the variation in the 3.6-micron data is clearly different between the two visits. Why is this? Well, Stevenson et al are not sure. One possibility is that the data are not well calibrated and that the difference results from systematic errors in the observations. After all, such observations are pushing the instruments to their very limits, beyond what they had been designed to do (back when no exoplanets were known and such observations were not conceived of).

More intriguingly, the planet might genuinely have been different on the different occasions. The authors report that, in order to model the spectra of the planet as it appears to be during the “blue” Visit 2 in the figure, the night-time face needs to be predominantly cloudy. But, if the clouds cleared, more heat would be let out and the infrared emission would be stronger. That might explain the higher flux during the “yellow” Visit 1. Here on Earth the sky regularly turns from cloudy to clear; is the same happening on WASP-43b?

Energy recirculation in the hot Jupiter WASP-19b

A team led by Ian Wong of Caltech have announced observations of the hot Jupiters WASP-19b and HAT-P-7b, looking at infra-red light using the Spitzer Space Telescope. By observing the planets around their entire orbit they detect the transit, caused by the planet passing in front of the host star, the secondary eclipse, when the planet passes behind the star, and the “phase curve” caused by the changing visibility of the heated face of the planet.
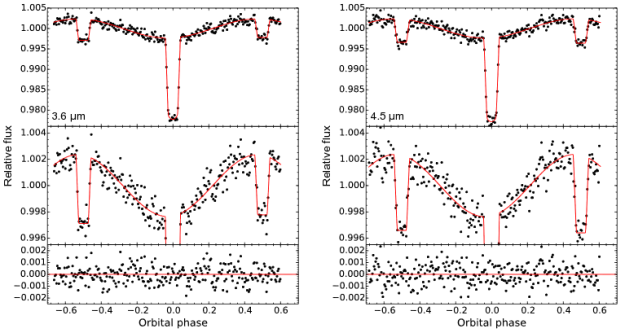
WASP-19b Spitzer lightcurve

The figure shows the infra-red light (“heat”) of the WASP-19 system in two pass bands (3.6 microns and 4.5 microns). The middle panels are expanded to show the phase curve, while the lowest panels show the residuals about a fitted model (the red line).

By fitting all three features, the authors can constrain the temperatures of the “day time” heated face of the planet (which faces towards us near the secondary eclipse) and of the “night time” face of the planet (which faces us near transit). From there they can estimate the “recirculation”, how efficient the planet is at redistributing heat from the day-time face to the night-time face.

Such short-period planets are phase-locked by tidal forces, and so always present the same face to the star. Thus redistribution of heat energy requires powerful winds circling the planet.

An interesting plot by Wong et al shows the recirculation in different hot Jupiters against the albedo (the fraction of energy that is reflected).
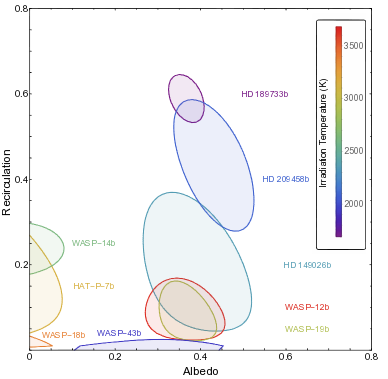
Energy recirculation in hot Jupiters.

There appear to be two groups of hot Jupiters: ones with albedos near 0.4, such as WASP-19b, and ones with much lower albedos, such as WASP-14b and WASP-18b. So far there is no simple explanation for this difference.

Further, the recirculation efficiency also appears to be different in different systems. Wong et al suggest that the hot Jupiters experiencing the highest irradiation, such as WASP-19b, are least efficient at redistributing heat, while
longer-period, less-irradiated hot Jupiters such as HD209458b and HD189733b are better at redistribution.