
WASP-43b is the “hot Jupiter” exoplanet with the orbit closest-in to its star, producing an ultra-short orbital period of only 20 hours. The dayside face is thus strongly heated, making it a prime system for studying exoplanet atmospheres.
Kevin Stevenson et al have pointed NASA’s Spitzer Space Telescope at WASP-43, covering the full orbit of the planet on three different occasions. Spitzer observed the infrared light from the heated face in two bands around 3.6 microns and 4.5 microns.
The three resulting “phase curves” are shown in the figure:
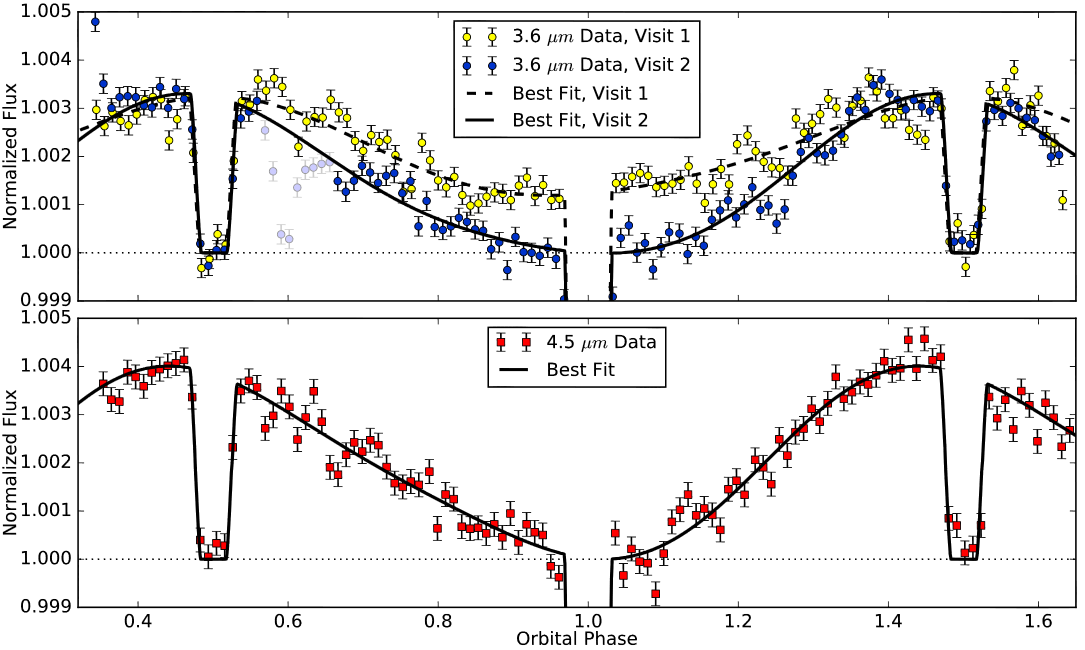
The 4.5-micron data from one visit are shown in red in the lower panel; the 3.6-micron data from the two other visits are in the upper panel. The transit (when the planet passes in front of the star) is at phase 1.0, and drops below the plotted figure. The planet occultation (when it passes behind the star) is at phase 0.5. The sinusoidal variation results from the heated face of the planet facing towards us (near phase 0.5) or away (near phase 1.0).
Intriguingly, the depth of the variation in the 3.6-micron data is clearly different between the two visits. Why is this? Well, Stevenson et al are not sure. One possibility is that the data are not well calibrated and that the difference results from systematic errors in the observations. After all, such observations are pushing the instruments to their very limits, beyond what they had been designed to do (back when no exoplanets were known and such observations were not conceived of).
More intriguingly, the planet might genuinely have been different on the different occasions. The authors report that, in order to model the spectra of the planet as it appears to be during the “blue” Visit 2 in the figure, the night-time face needs to be predominantly cloudy. But, if the clouds cleared, more heat would be let out and the infrared emission would be stronger. That might explain the higher flux during the “yellow” Visit 1. Here on Earth the sky regularly turns from cloudy to clear; is the same happening on WASP-43b?
